candlestick patterns for day trading

PDF 8 sahifa 46,2 KB Bepul yuklash

Sahifa ko'rinishi (5 sahifa)

Pastga aylantiring 👇
1 / 8
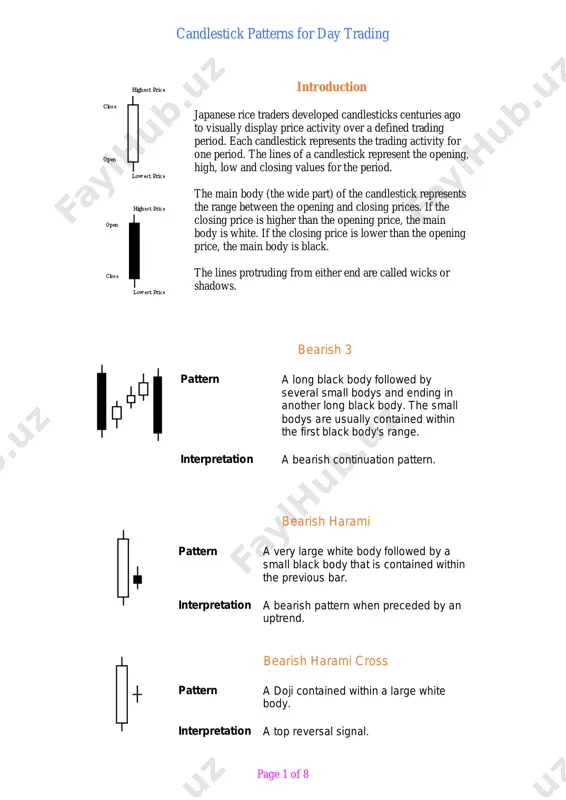
page 1 of 8 candlestick patterns for day trading introduction japanese rice traders developed candlesticks centuries ago to visually display price activity over a defined trading period. each candlestick represents the trading activity for one period. the lines of a candlestick represent the opening, high, low and closing values for the period. the main body (the wide part) of the candlestick represents the range between the opening and closing prices. if the closing price is higher than the opening price, the main body is white. if the closing price is lower than the opening price, the main body is black. the lines protruding from either end are called wicks or shadows. bearish 3 pattern a long black body followed by several small bodys and ending in another long black body. the small bodys are usually contained within the first black body's range. interpretation a bearish continuation pattern. bearish harami pattern …
2 / 8
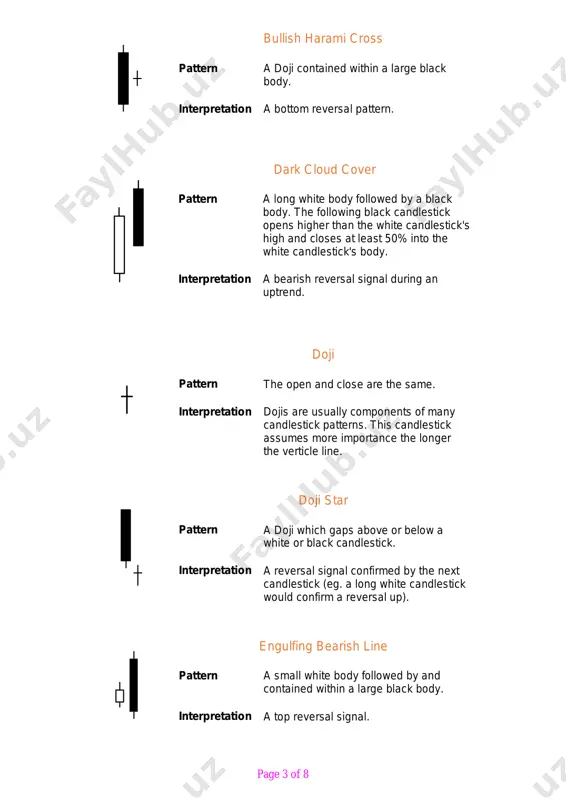
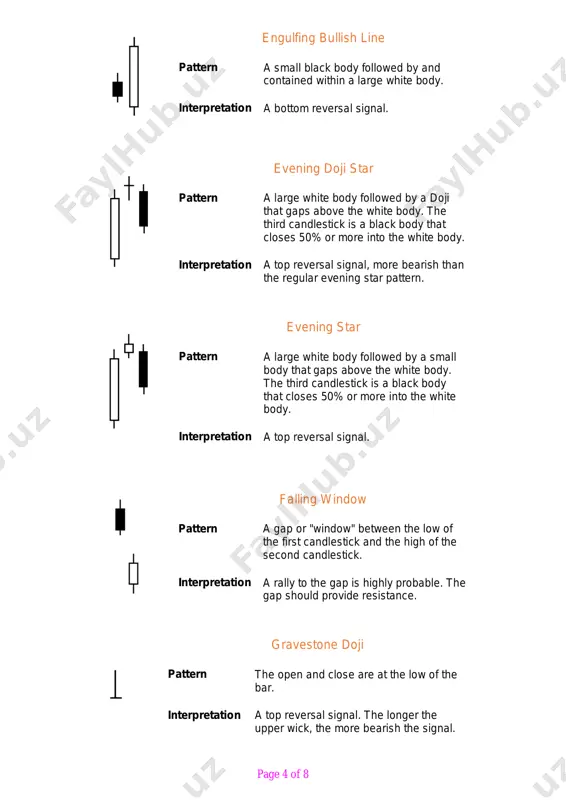
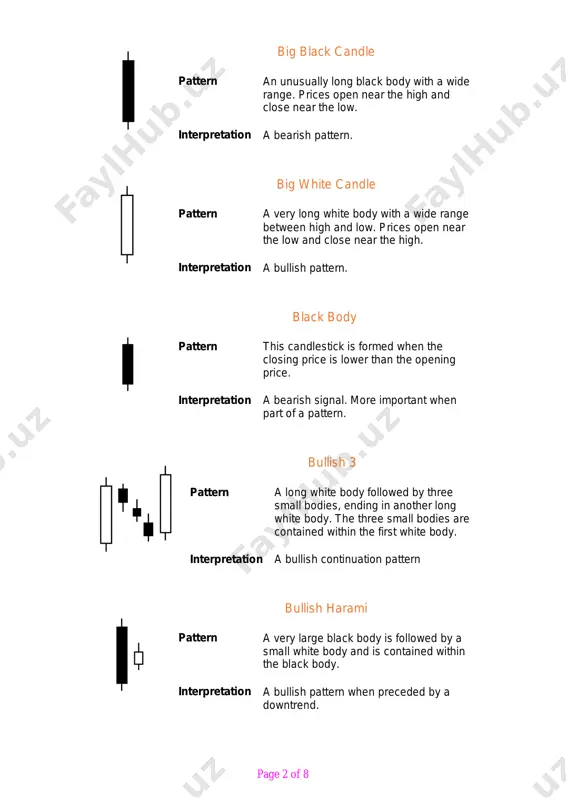
ll white body and is contained within the black body. interpretation a bullish pattern when preceded by a downtrend. page 3 of 8 bullish harami cross pattern a doji contained within a large black body. interpretation a bottom reversal pattern. dark cloud cover pattern a long white body followed by a black body. the following black candlestick opens higher than the white candlestick's high and closes at least 50% into the white candlestick's body. interpretation a bearish reversal signal during an uptrend. doji pattern the open and close are the same. interpretation dojis are usually components of many candlestick patterns. this candlestick assumes more importance the longer the verticle line. doji star pattern a doji which gaps above or below a white or black candlestick. interpretation a reversal signal confirmed by the next candlestick (eg. a long white candlestick would confirm a reversal up). engulfing bearish line pattern a small …
3 / 8
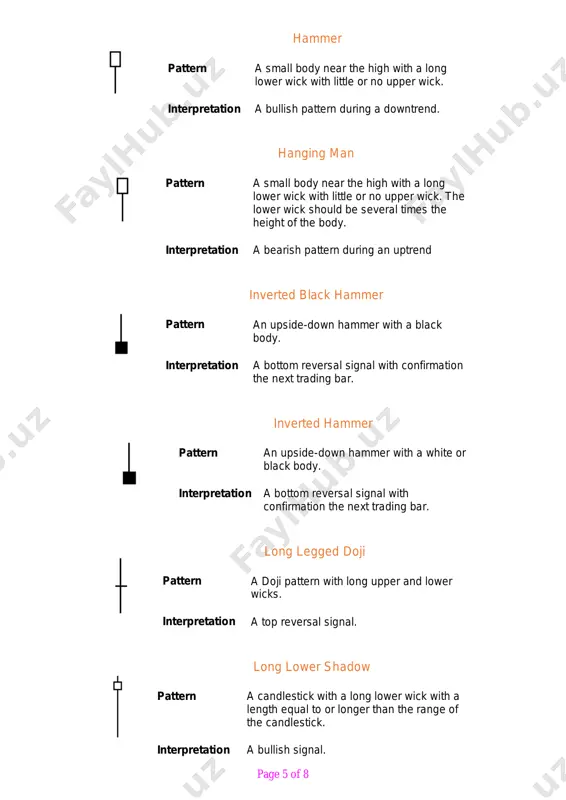
rsal signal. the longer the upper wick, the more bearish the signal. page 5 of 8 hammer pattern a small body near the high with a long lower wick with little or no upper wick. interpretation a bullish pattern during a downtrend. hanging man pattern a small body near the high with a long lower wick with little or no upper wick. the lower wick should be several times the height of the body. interpretation a bearish pattern during an uptrend inverted black hammer pattern an upside-down hammer with a black body. interpretation a bottom reversal signal with confirmation the next trading bar. inverted hammer pattern an upside-down hammer with a white or black body. interpretation a bottom reversal signal with confirmation the next trading bar. long legged doji pattern a doji pattern with long upper and lower wicks. interpretation a top reversal signal. long lower shadow pattern a candlestick …
4 / 8
that opens lower than the black candlestick's low, but closes 50% or more into the black body. interpretation a bottom reversal signal. page 7 of 8 rising window pattern a gap or "window" between the high of the first candlestick and the low of the second candlestick. interpretation a selloff to the gap is highly likely. the gap should provide support. uptrend downtrend separating lines pattern in an uptrend, a black candlestick is followed by a white candlestick with the same opening price. in a downtrend, a white candlestick is followed by a black candlestick with the same opening price. interpretation a continuation pattern. the prior trend should resume. shaven bottom pattern a candlestick with no lower wick. interpretation a bottom reversal signal with confirmation the next trading bar. shaven head pattern a candlestick with no upper wick. interpretation a bullish pattern during a downtrend and a bearish pattern during …
5 / 8
ahoo.com mailto:ej_az_2002@yahoo.com

Ko'proq o'qimoqchimisiz?

Barcha 8 sahifani Telegram orqali bepul yuklab oling.

To'liq faylni yuklab olish

"candlestick patterns for day trading" haqida

page 1 of 8 candlestick patterns for day trading introduction japanese rice traders developed candlesticks centuries ago to visually display price activity over a defined trading period. each candlestick represents the trading activity for one period. the lines of a candlestick represent the opening, high, low and closing values for the period. the main body (the wide part) of the candlestick represents the range between the opening and closing prices. if the closing price is higher than the opening price, the main body is white. if the closing price is lower than the opening price, the main body is black. the lines protruding from either end are called wicks or shadows. bearish 3 pattern a long black body followed by …

Bu fayl PDF formatida 8 sahifadan iborat (46,2 KB). "candlestick patterns for day trading"ni yuklab olish uchun chap tomondagi Telegram tugmasini bosing.
Teglar: candlestick patterns for day tr… PDF 8 sahifa Bepul yuklash Telegram