homework-chapter # 8

PDF 5 стр. 1,5 МБ Бесплатная загрузка

Предварительный просмотр (5 стр.)

Прокрутите вниз 👇
1 / 5
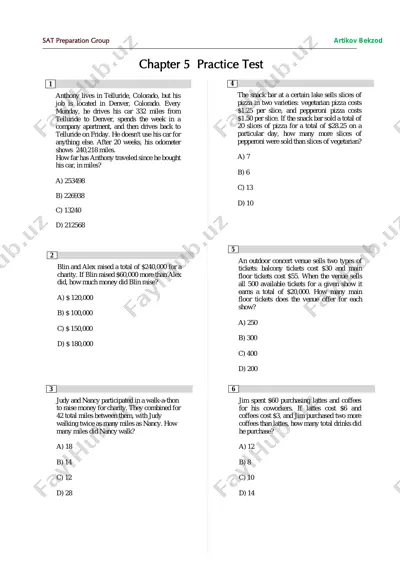
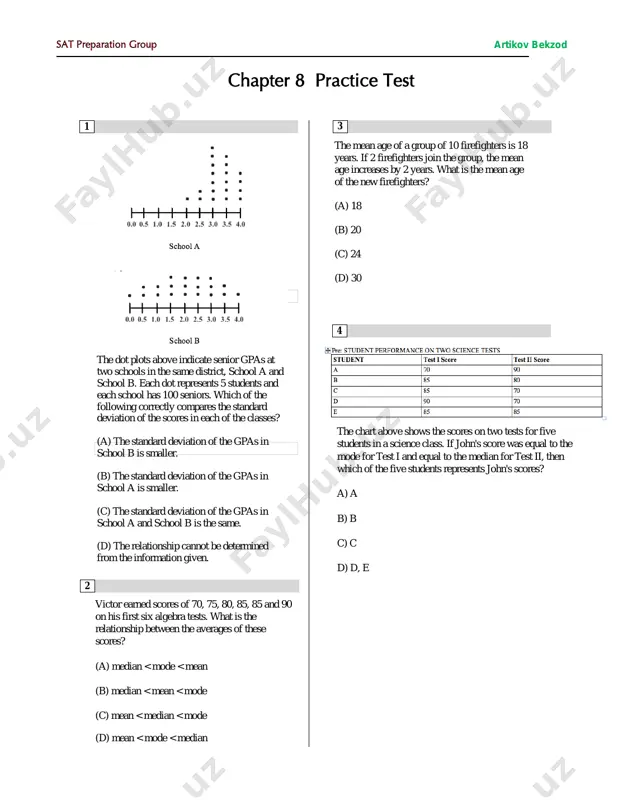
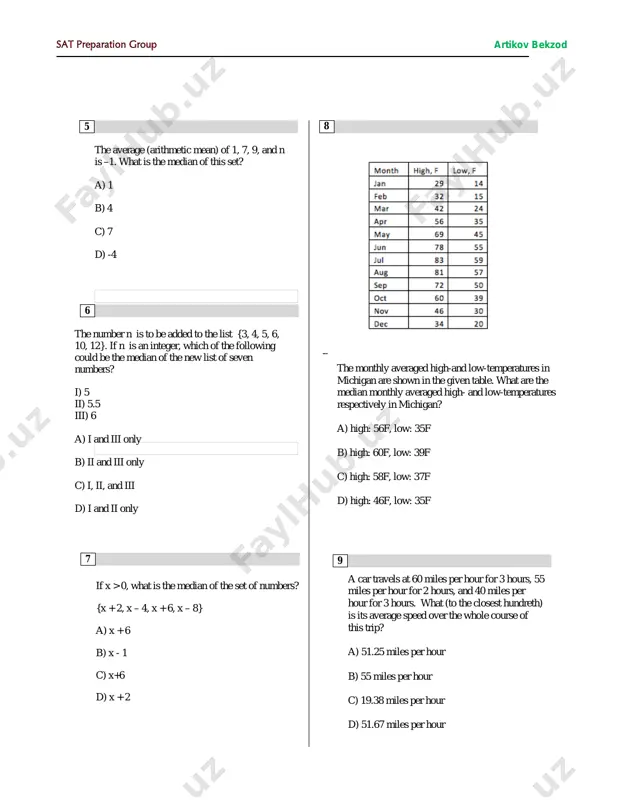
1 4 sat preparation group artikov bekzod chapter 8 practice test the dot plots above indicate senior gpas at two schools in the same district, school a and school b. each dot represents 5 students and each school has 100 seniors. which of the following correctly compares the standard deviation of the scores in each of the classes? (a) the standard deviation of the gpas in school b is smaller. (b) the standard deviation of the gpas in school a is smaller. (c) the standard deviation of the gpas in school a and school b is the same. (d) the relationship cannot be determined from the information given. victor earned scores of 70, 75, 80, 85, 85 and 90 on his first six algebra tests. what is the relationship between the averages of these scores? (a) median 0, what is the median of the set of numbers? {x + 2, …
2 / 5
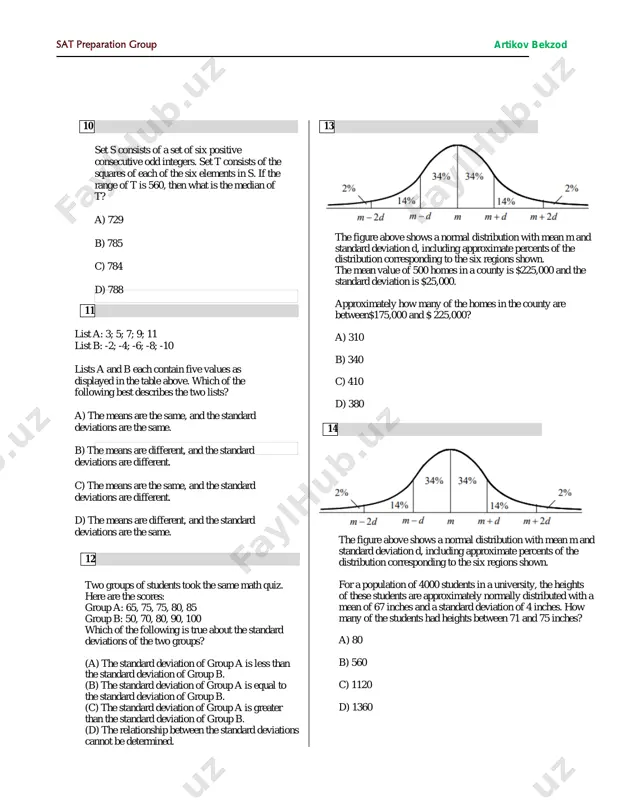
oup b: 50, 70, 80, 90, 100 which of the following is true about the standard deviations of the two groups? (a) the standard deviation of group a is less than the standard deviation of group b. (b) the standard deviation of group a is equal to the standard deviation of group b. (c) the standard deviation of group a is greater than the standard deviation of group b. (d) the relationship between the standard deviations cannot be determined. 13 the figure above shows a normal distribution with mean m and standard deviation d, including approximate percents of the distribution corresponding to the six regions shown. the mean value of 500 homes in a county is $225,000 and the standard deviation is $25,000. approximately how many of the homes in the county are between$175,000 and $ 225,000? a) 310 b) 340 c) 410 d) 380 the figure above shows a …
3 / 5
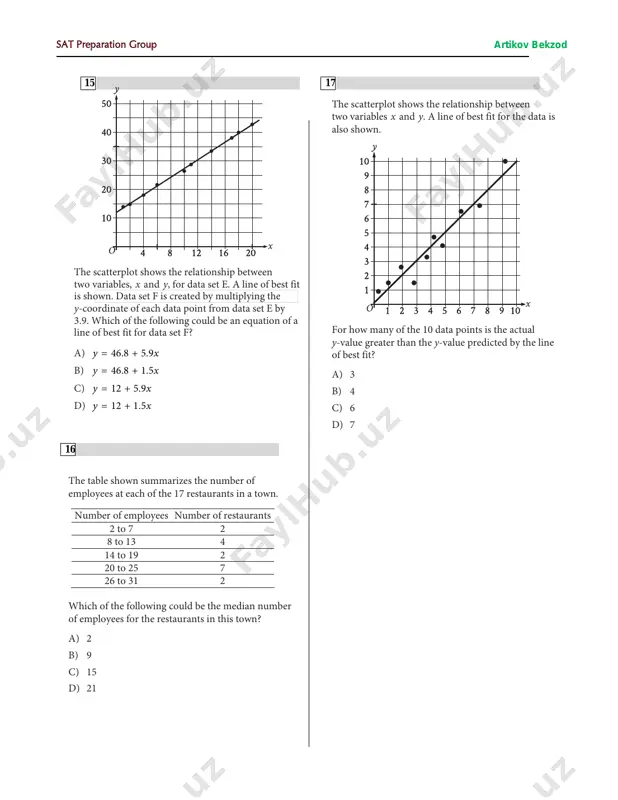
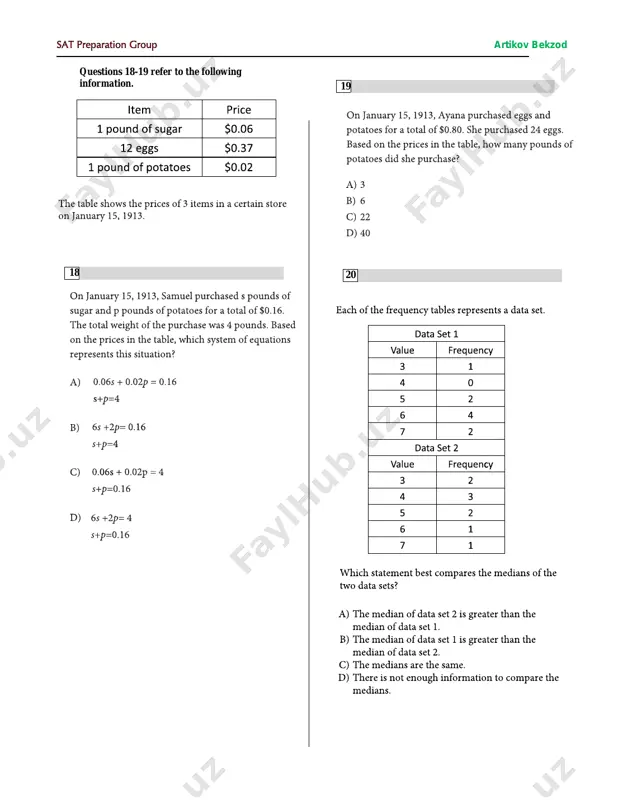
be the median number of employees for the restaurants in this town? a) 2 b) 9 c) 15 d) 21 16 y 10 9 8 7 6 5 4 3 2 1 l, 7 ,_ v / / v • v y. /. •v -v • x 12345678910 the scatterplot shows the relationship between two variables x and y. a line of best fit for the data is also shown. for how many of the 10 data points is the actual y-value greater than the y-value predicted by the line of best fit? a) 3 b) 4 c) 6 d) 7 artikov bekzod sat preparation group questions 18-19 refer to the following information. 18 19 20 acing_frontcover (pdf) acing the new sat - contents-ebook acing the new sat -ch 1 the language and tools of algebra acing the new sat -ch 2 solving linear equations acing the new sat -ch …
4 / 5
homework-chapter # 8 - Page 4
5 / 5
homework-chapter # 8 - Page 5

Хотите читать дальше?

Скачайте все 5 страниц бесплатно через Telegram.

Скачать полный файл

О "homework-chapter # 8"

1 4 sat preparation group artikov bekzod chapter 8 practice test the dot plots above indicate senior gpas at two schools in the same district, school a and school b. each dot represents 5 students and each school has 100 seniors. which of the following correctly compares the standard deviation of the scores in each of the classes? (a) the standard deviation of the gpas in school b is smaller. (b) the standard deviation of the gpas in school a is smaller. (c) the standard deviation of the gpas in school a and school b is the same. (d) the relationship cannot be determined from the information given. victor earned scores of 70, 75, 80, 85, 85 and 90 on …

Этот файл содержит 5 стр. в формате PDF (1,5 МБ). Чтобы скачать "homework-chapter # 8", нажмите кнопку Telegram слева.
Теги: homework-chapter # 8 PDF 5 стр. Бесплатная загрузка Telegram