correlation and regression analysis methods
Page preview (5 pages)
Scroll down 👇


About "correlation and regression analysis methods"
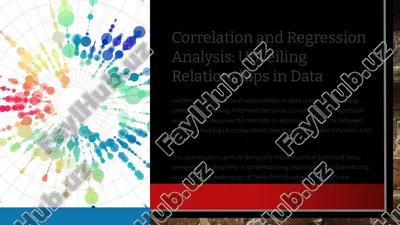
correlation and regression analysis methods correlation and regression analysis methods podzagolovok plan definition and purpose of correlation and regression types and interpretation of correlation and regression application with table and graphical representation what is correlation? • correlation is a statistical method used to measure the strength and direction of a linear relationship between two numerical variables. • it is expressed by the correlation coefficient (r), which ranges from -1 to +1: • +1 → perfect positive linear relationship • -1 → perfect negative linear relationship • 0 → no linear relationship • example: as the number of hours studied increases, the exam score also increases. this shows a positive correlation. • regression is a method that shows how one variable …
This file contains 13 pages in PDF format (4.3 MB). To download "correlation and regression analysis methods", click the Telegram button on the left.
 PPTX
PPTX
 PPTX
PPTX
 DOC
DOC
 DOC
DOC
 DOCX
DOCX
 DOC
DOC
 DOCX
DOCX
 DOCX
DOCX
 DOCX
DOCX
 DOC
DOC
 DOCX
DOCX
 DOC
DOC