correlation and regression analysis methods
Sahifa ko'rinishi (5 sahifa)
Pastga aylantiring 👇


Ko'proq o'qimoqchimisiz?
Barcha 13 sahifani Telegram orqali bepul yuklab oling.
To'liq faylni yuklab olish"correlation and regression analysis methods" haqida
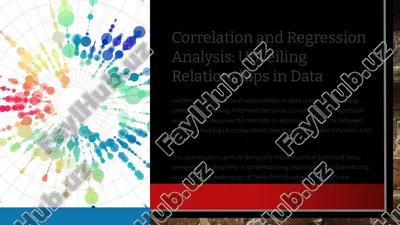
correlation and regression analysis methods correlation and regression analysis methods podzagolovok plan definition and purpose of correlation and regression types and interpretation of correlation and regression application with table and graphical representation what is correlation? • correlation is a statistical method used to measure the strength and direction of a linear relationship between two numerical variables. • it is expressed by the correlation coefficient (r), which ranges from -1 to +1: • +1 → perfect positive linear relationship • -1 → perfect negative linear relationship • 0 → no linear relationship • example: as the number of hours studied increases, the exam score also increases. this shows a positive correlation. • regression is a method that shows how one variable …
Bu fayl PDF formatida 13 sahifadan iborat (4,3 MB). "correlation and regression analysis methods"ni yuklab olish uchun chap tomondagi Telegram tugmasini bosing.
 PPTX
PPTX
 PPTX
PPTX
 DOC
DOC
 DOC
DOC
 DOCX
DOCX
 DOC
DOC
 DOCX
DOCX
 DOCX
DOCX
 DOCX
DOCX
 DOC
DOC
 DOCX
DOCX
 DOC
DOC